Reports
- 29 Mar 2023
- 7 Minutes to read
- Print
- DarkLight
- PDF
Reports
- Updated on 29 Mar 2023
- 7 Minutes to read
- Print
- DarkLight
- PDF
Article Summary
Share feedback
Thanks for sharing your feedback!
Reporting is a core functionality that you can use to help keep track of your winery's performance and make day-to-day decisions. With enhanced reports, you will experience a faster, more reliable reporting system with an updated design.
This section documents the latest version of our reporting tools
Column Headers
Are you used to the old reports system? Some column headers have changed for enhanced reports, which may impact any integrations you have set up.
Before relying on integration data using enhanced reports, update the column headers with the vendor you have integrated with your WineDirect account.
Download the updated reports header file to determine what changes you need to make (XLS) >
Report Name & Category Changes
To improve usability, i.e., I have changed some of the report names and categories in the new reporting tools o better reflect the information they provide. The following report names and categories have changed.
| Old Name | New Name | Updated Report Category |
|---|---|---|
| Abandon Carts | Abandoned Carts | Marketing |
| Allocations | Allocation Summary | Allocations |
| Card Updater | Credit Card Updates | Club Members |
| Compli | Compli | Compliance |
| Cost Of Goods | Cost of Goods | Financial |
| Coupon Usage | Coupon Usage | Marketing |
| Credits Summary | Credits Summary | Product |
| Credits Transaction | Credits Transaction | Product |
| Customer List | Contact List | Contacts |
| Daily Activity Report | Daily Activity Report | Financial |
| Email Detailed/Summary | Email Detailed/Summary | Marketing |
| Event Tickets | Event Tickets | Product |
| *This is a new report | FedEx Canada Report | Shipping |
| FedEx Shipment Export | FedEx Shipments | Financial |
| Forms | Forms | Marketing |
| Gift Card Summary | Gift Card Summary | Product |
| Gift Card Transactions | Gift Card Transactions | Product |
| Guest Count | Guest Count | Contacts |
| Inventory Sold | Inventory Sold | Product |
| Inventory Summary | Inventory Summary | Product |
| Inventory Transactions | Inventory Transactions | Product |
| Inventory Velocity | Inventory Velocity | Product |
| Label Report | Shipping Labels | Shipping |
| Lifetime Value | Lifetime Value | Contacts |
| Nexternal | Nexternal Order Export | Shipping |
| Payment Report | Payment Gateway | Financial |
| *This is a new report | POS End Of Day | Financial |
| Qualification Date | Club Members On X Date | Club Members |
| QuickBooks | QuickBooks | Financial |
| QuickBooks V2 | QuickBooks V2 | Financial |
| Sales by Category | Sales Summary by Category | Sales |
| Sales by Customer | Orders by Customer | Sales |
| Sales by Date | Orders by Ship/Pickup Date | Sales |
| Sales by Order Number | Orders by Number | Sales |
| Sales by Sales Associate | Sales Summary by Associate | Sales |
| Sales by SKU | Sales Summary by Product | Sales |
| Sales by State | Sales Summary by State | Sales |
| Sales by Tender Detail | Payment Type Detail | Financial |
| Sales by Tender Type | Payment Type Summary | Financial |
| Sales by Detail X | Order Detail | Sales |
| Search Summary | Search Summary | Marketing |
| Search Log Detail | Search Detail | Marketing |
| Ship Compliant | ShipCompliant Products | Product |
| ShipCompliant (1011) | ShipCompliant | Compliance |
| User Choice Clubs | User Choice Club Seasons | Club Members |
| WineDirect Fulfillment | WineDirect | Shipping |
| WSN Report | WSN-205 | Shipping |
Reports Actions
Learn the functions of each of the buttons found within a report.
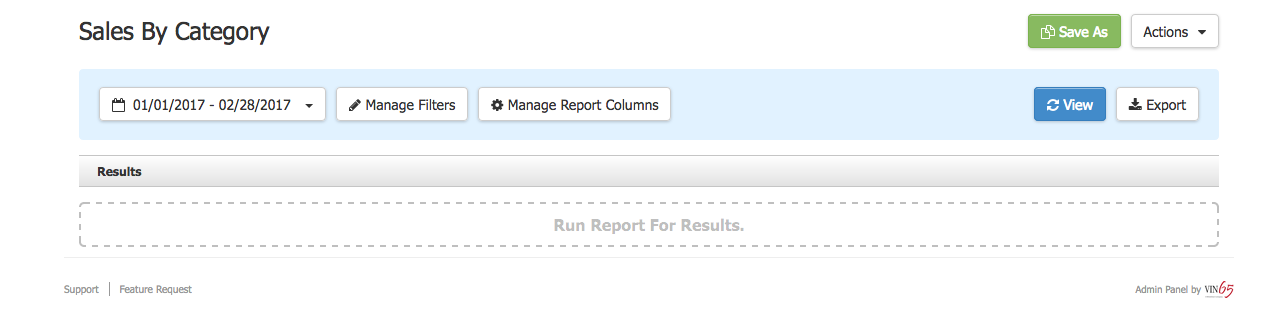
Running Reports
To run a report, you must first select a report to work off of. Please select one of our Default Reports on the main reports page r from your list of Saved Reports.
Once you have selected the report, you must set the parameters around which you'd like to run your data.
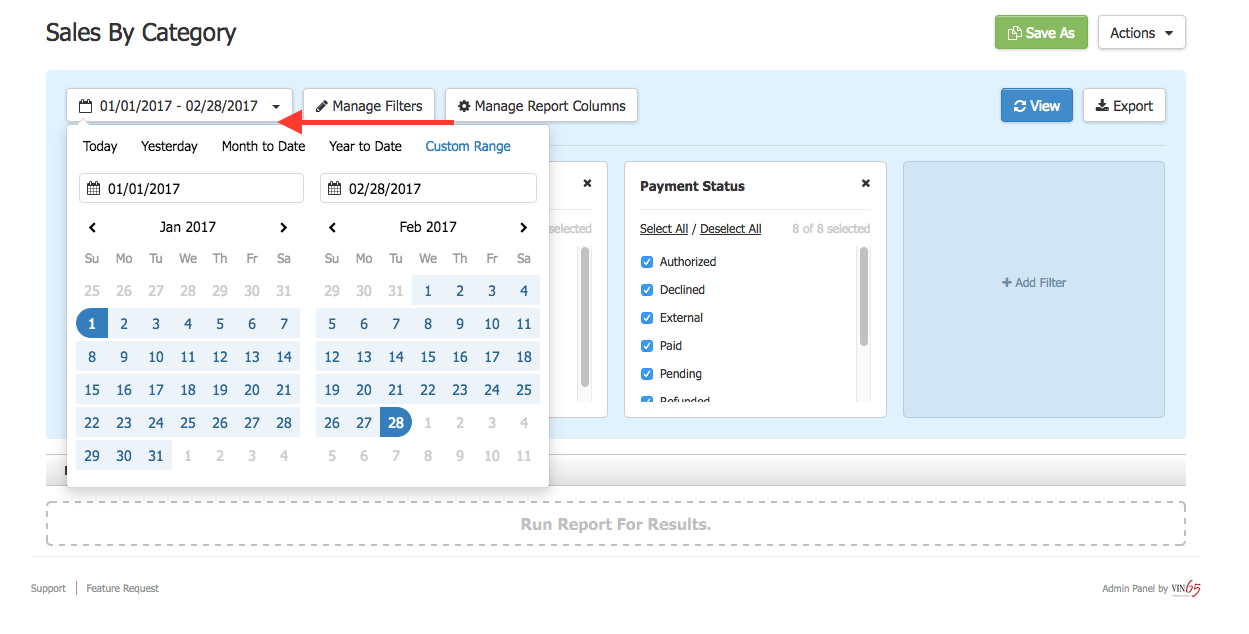
1. Select the Date Range to determine the date(s) you want to run data for.
2. Select Manage Filters to show or hide the filters selected for your report. You can add a new filter by clicking on + Add Filter.
3. You can remove filters by clicking on the X icon in the upper right of the Filter you want to eliminate.
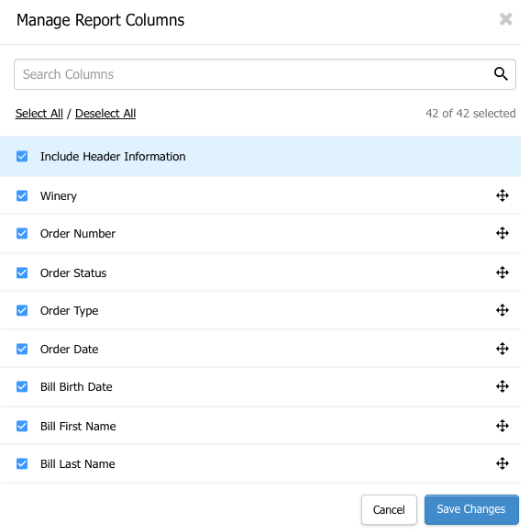
4. Select Manage Columns to open a screen displaying the columns available for your report.
5. Once you are happy with the filters and columns, click View to generate the report. It will display in the Results section below for you to view. If you change your filters or columns, click View each time to refresh the results below.
6. To save the results and download them to your computer as a . CSV file, click Export. This will refresh the selected data and queues your report for Export.
7. When you click Export, a message of "[Report Name] is being generated." will display. As soon as the report is fully generated, a message o[Report Name] is ready for download." will display. The report will now be available to download from the browser.
Report(s) will continue to generate even if you leave the Reports section. When you return to Reports, there will be an Alert notifying you that a report is ready for download. This is useful when working with reports containing large amounts of data that may take longer to generate.
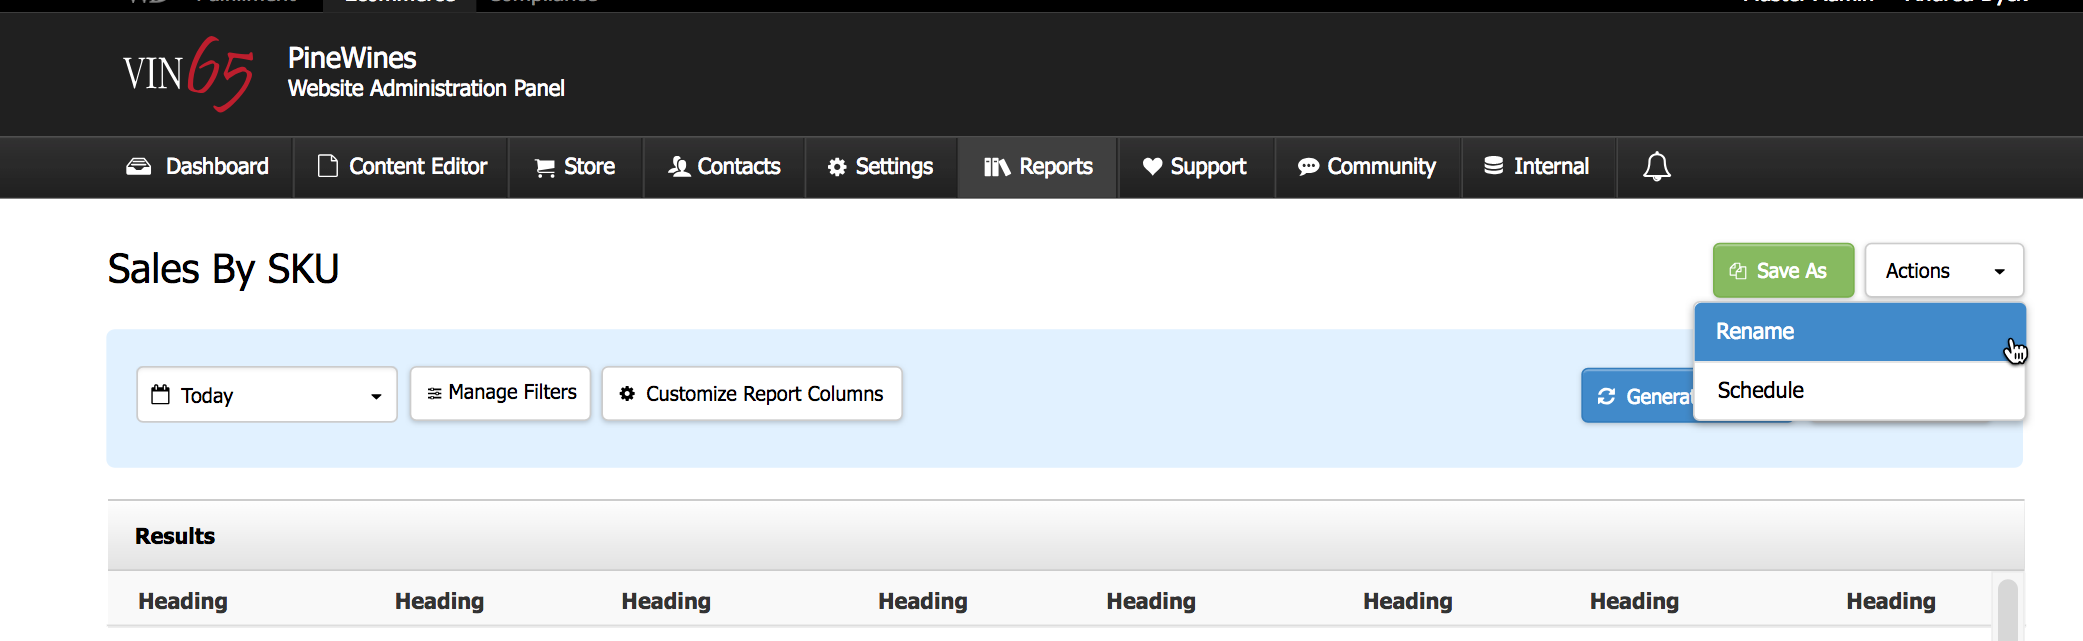
8. You can also click Save As to save your report and the custom parameters you have set. These will appear on the main Reports page under 'Saved Reports' and can be edited or deleted at your discretion.
9. To have your report run automatically in the future, select Actions > Schedule. This feature allows you to schedule your report once or to run recurring on a daily, weekly, monthly, or yearly basis.
Manage Filters
The Manage Filters button toggles your filters to appear or disappear from View on your report. Select + Add Filter once visible to add additional available filters.
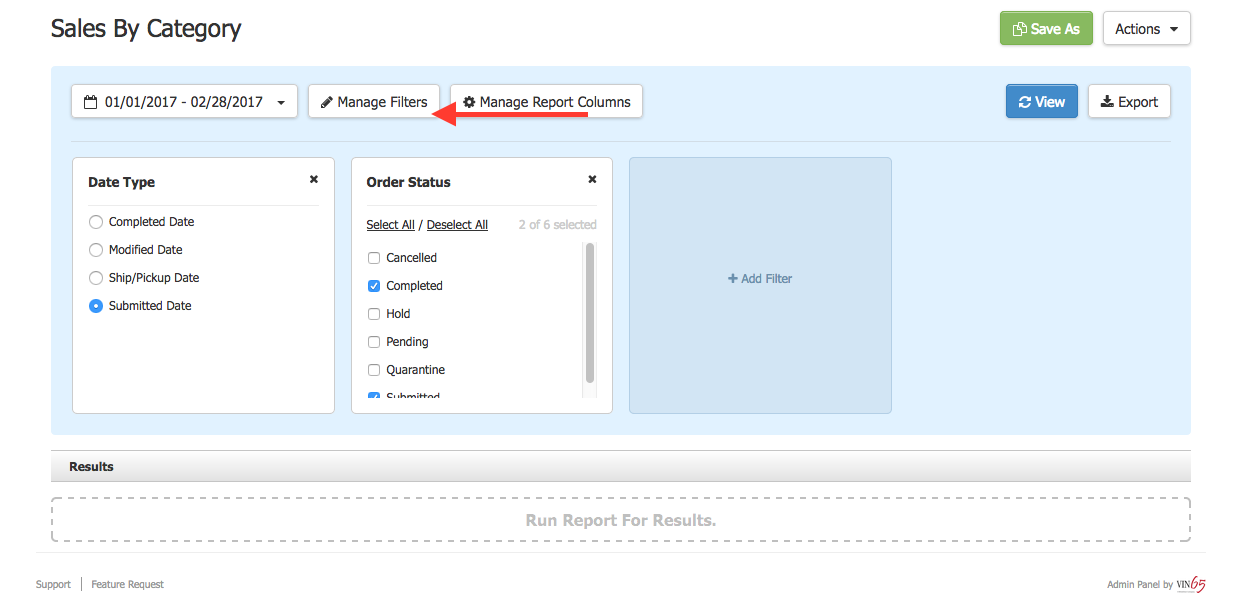
Filters are the main way to configure your reports to obtain the data you are looking for. They allow you to set parameters on which information will be generated in the report and are available based on how information is stored in the WineDirect databases.
For Quarantine Orders: The date the payment is captured will be the Submitted Date. When the Quarantine is addressed, and the order status is Completed, that will be the Completed Date.
You can add a filter by selecting Manage Filters, then click on + Add Filter. You can check or uncheck which filters you would like applied or removed. Within the available filters
Be sure to click View to refresh your report results when you change any filters or columns.
Manage Columns
To customize a report, you can also click on Manage Columns. Once selected, the Manage Columns pop-up will appear. You can choose the columns you want to include in your report or exclude. Each of the checkboxes represents a column header which will be generated in your report.
Include Header Information to determine if the report will display Report Name Winery Name, and Date Range.
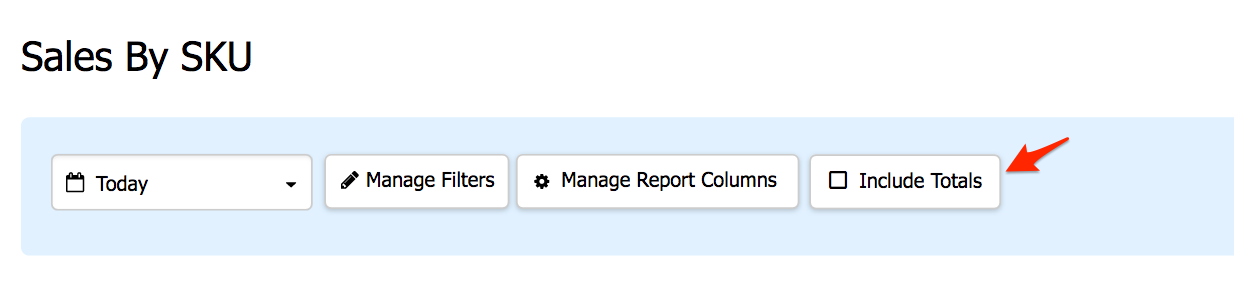
Include Totals
On some Sales and Financials reports, you can determine whether or not to display a total sum at the bottom of the report through the Include Totals checkbox. Your report will include a total sum at the bottom of the columns when checked. When unchecked, the report will not display a total sum.
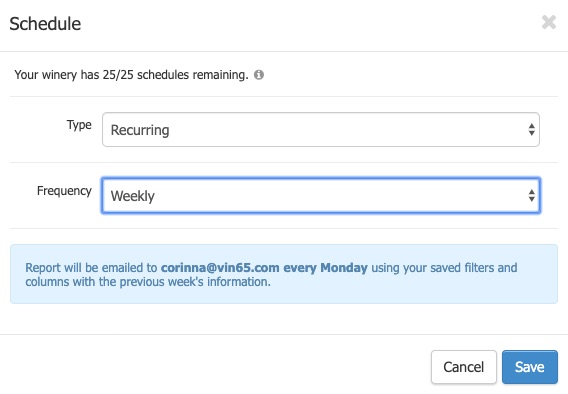
Scheduling Reports
Scheduled reports save you time as you can set them up and deliver them to your inbox. Click Actions > Schedule to open the Schedule dialog box when within a report. Here you can select if you want to schedule a report to run once or regularly da, daily, weekly, monthly, or yearly.
The date you select must be in the future by at least one day, and the time at which it will generate can't be specified.
Daily recurring reports will run based on the previous day's data, and weekly reports will run using Monday through Sunday data of the previous week, arriving in your inbox on Monday. Monthly reports will run on the first of each month. Wineries are limited to 25 recurring scheduled reports across each of their websites.
FAQs
How do I change the filters and columns on a report?
Once within a report, click Manage Filters and Manage Columns to add or modify the filters and columns.
You can change the order of the columns by dragging and dropping the fields within the Manage Columns section. This will alleviate the need to move them in your spreadsheet.
You can add filters in the Manage Filters section by clicking the + Add Filter box and selecting from the predetermined filters.
Why can't I access all the same filters and columns on all reports?
Different data is maintained in different databases, making it impossible to have all filters and columns available across all reports and
How do I schedule a report?
When you're within a report, click Actions > Schedule to schedule your report. You can only have one schedule set up at a time per the report; however, you can always cancel any schedules you put in place.
Can I schedule a report to run at a certain time of the day?
No, reports cannot be scheduled to generate an email to you at a specific time of the day. Most scheduled reports will be pulled at midnight and emailed at that time.
How do I modify a saved report?
Click the saved report, change your filters and columns, then select View. You can either click Save to keep the same report name and overwrite the data or Save As to add a new name to the report.
What happens when I export a report?
When you click Export, your report is added to our generation queue. Based on its size, it will be queued in our system, and an alert via the bell at the top right of the Reports tab will notify you when it is available for download.
Can I still access the old reporting interface?
For a limited time, you can access the old reporting interface. This is to ensure that you're comfortable with the new tools. To view the old reporting interface, click Reports in the admin panel and then click the 'Back to Old Reports' button on the right. (Click the 'Try Enhanced Reports' button to return to the new tools.)
How do I view my custom reports?
Custom reports will move to the new interface in the next stage of development. For now, you can access your custom reports through the old interface.
How do I rename my Saved Reports?
To rename a Saved Report, click on the Saved Report you want to rename and click on Actions. There will be an option to Rename the saved report.
Was this article helpful?